


Make more money, make more money, make more money.
You’d be forgiven for basing your sales strategy around that principle.
But life is tough as a sales executive. You’re a chameleon — a sales expert one second; a friend, confidant, or tough-talking manager the next. You're responsible for everything; what needs doing tomorrow and whether there's any money in the coffers to even keep the office open. Make more money, make more money. Grow.
But there’s more to growth than just making more sales. Look beyond how many deals you closed in a certain period and divulge the factors that have a direct impact on your sales success. Learn from them, invest in them, and make them better. Learn how to learn about your business with regular sales pipeline reports. Answer crucial questions about your sales pipeline metrics and immediate processes.
By the end of this article, you'll know:
Hold a regular sales pipeline review to answer the following questions...
- What are the total number of opportunities in our pipeline?
- Does the total value of those opportunities meet our revenue goals?
- Do we have the resources to close the deals in our pipeline?
- What percentage of our leads do we close successfully?
- How many leads do we lose and why?
- Which salesperson, which season, and to which customers do we sell best?
- Is our product maintaining relevance?
- How fast and why are our customers leaving us?
- Can we improve our after-sale programme?
- How much money can we expect to make in the immediate future?
- Does my sales team need any sales enablements from me?
- What resources do we need?
- Where can we invest more?
- Where should we invest less?
- Are we going in the right direction?
How to generate sales pipeline reports in NetHunt CRM
With all your business data held and maintained in a CRM system, sales pipeline reports are easy. NetHunt CRM offers easy, built-in report generation to help analyse all that lovely data in your pipeline.
The best thing is, it just takes two easy steps. First we need to build a view with all the relevant filters for us to report, and then we generate a report based on that view in any chosen format.
- Go to the relevant folder holding records you want to report.
- Group them by any field.
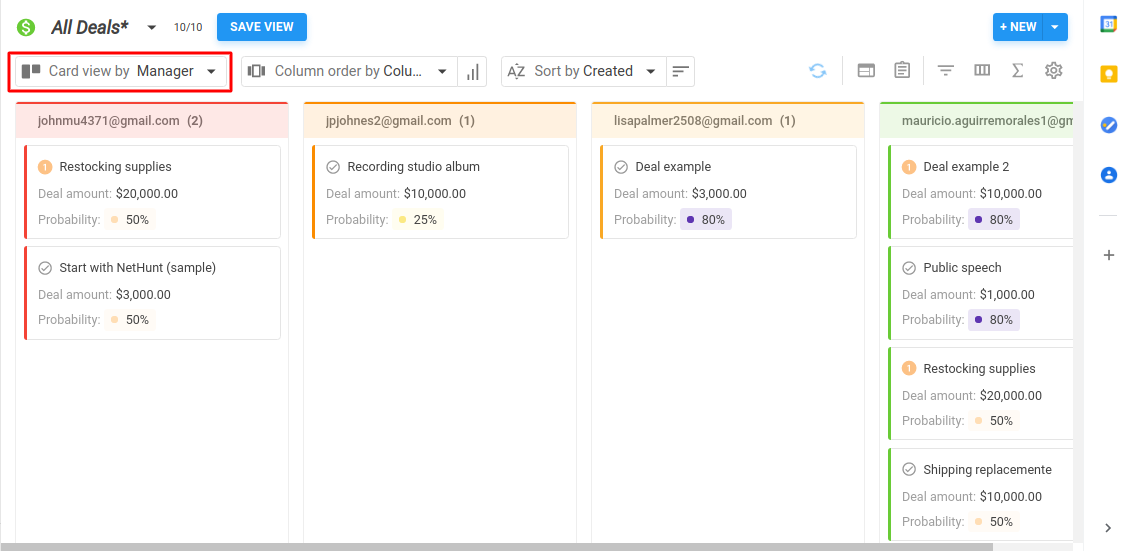
- Apply the necessary filters.
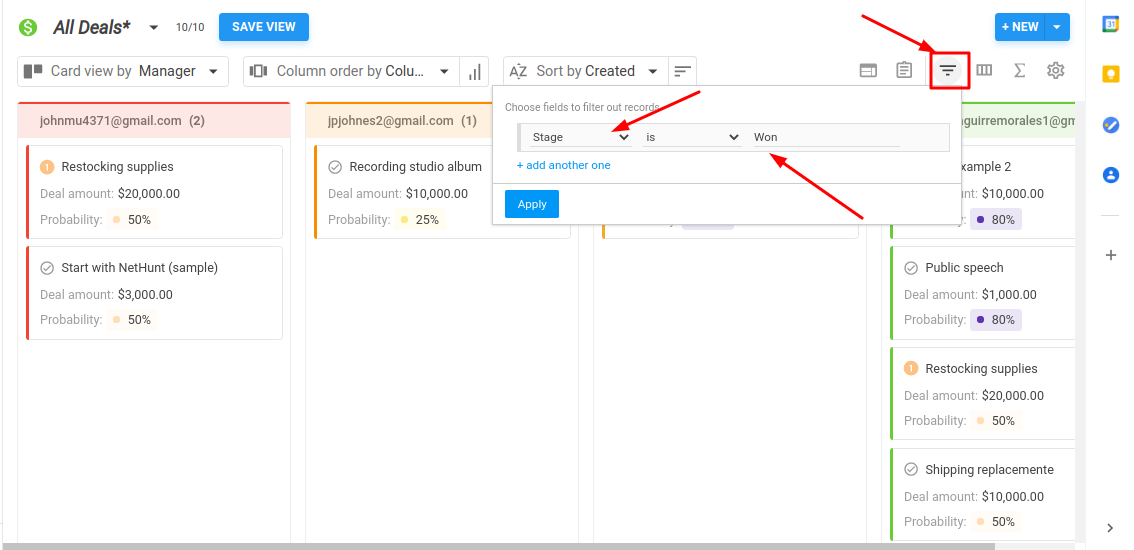
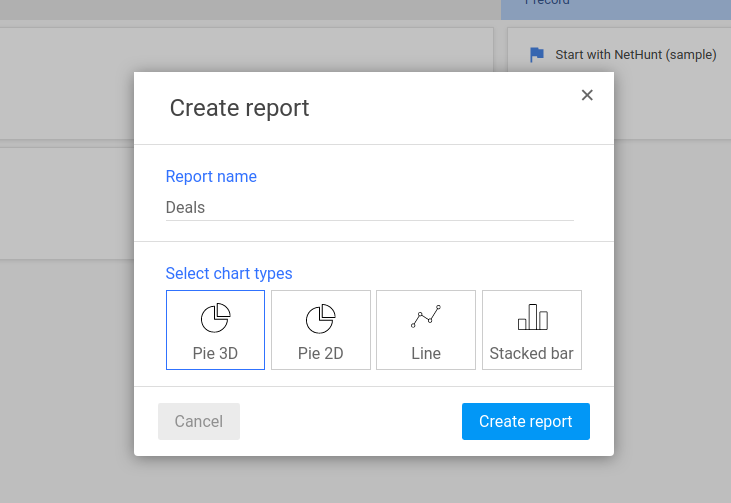
- Click the Create report button.
- Choose a chart type and hit the Create a report button.
Not a NetHunt customer?
Sign up for your free NetHunt trial. Enjoy unlimited access to a growing library of features in our Gmail CRM. Sales pipelines, reports, sales automation, email features, Tasks, web forms, native integrations with Messenger, Intercom, LinkedIn, alongside loads more features to put your whole business right at your fingertips.
Key sales pipeline metrics for C-level executives to monitor
The following is a list of the key strong sales pipeline metrics that a business C-Suite needs to monitor, embrace, and champion as part of their continued quest for growth, revenue, and customer happiness.
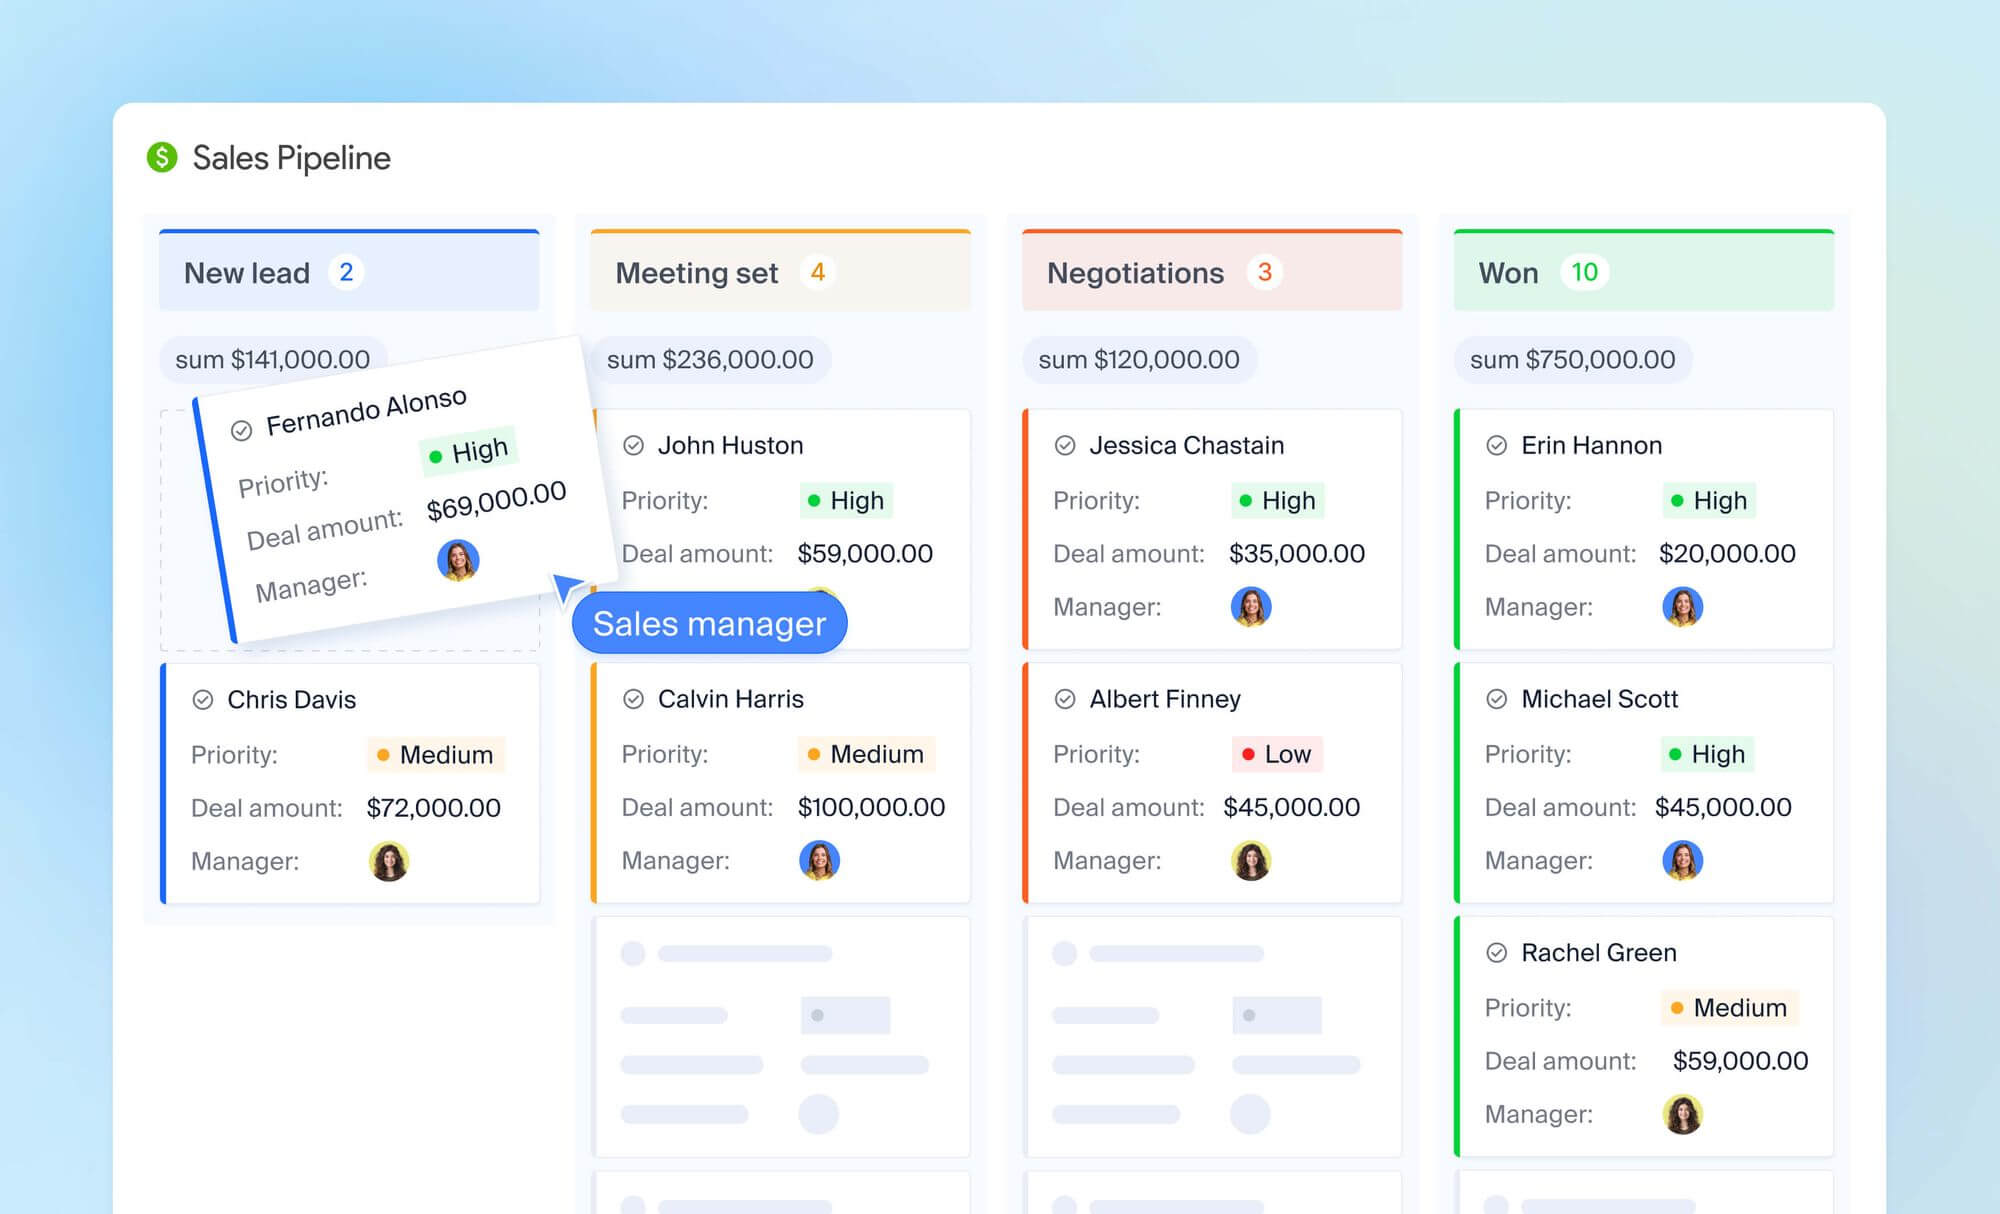
Total pipeline opportunities
I did say in the introduction to look beyond this, but don’t rule it out.
Total pipeline opportunities refer to the amount of opportunities in your sales pipeline that are real, convertible opportunities for leads to turn into customers. It is an all-encompassing and simple report to do the maths for, by simply adding up all the unclosed deals in your pipeline at any given time: New deals, negotiations entered, and offers sent.
This is the baseline for any immediate forecast; it’s everything sales reps have to deal with. It’s everything that sales managers need to spread their resources around. The total opportunities in your pipeline are ground-zero for any upcoming activities, so it tends to be the first place to go in a sales pipeline report.
The total opportunities report also forms a basis for other reporting metrics.
This one helps the higher echelons of business executives answer important questions...
- What are the total number of convertible opportunities in your sales pipeline?
- Does the total value of those opportunities meet our revenue goals?
- Do we have the resources to deal with all the opportunities in our pipeline?
Win rate
If you’re not winning, you’re losing.
(Closed deals [won] ÷ Closed deals [won and lost]) x 100
Imagine your sales team managed to secure 50 won deals out of a possible 100, they would be hitting a (quite respectable) 50% win rate for any time period chosen by the reporter.
Sales win rate is the percentage of successfully closed deals a sales team achieves in any chosen period of time. A company's win rate should be near the top of the list for reporting sales executives.
It offers an understanding as to the effectiveness of your sales process and sales people, giving a clear indication as to whether you’re targeting the correct lead generation channels and whether your marketing materials work as they should do. The lesson is that if you’re not winning, you’re losing.
Win rate is best used comparatively to highlight progress or deterioration between different sales timeframes. We can segment our win rate between different members of our sales teams, different demographics of customers, and even the time of year in which we’re selling.
It all adds up to give us a better idea of our sales process and where our resources need to be distributed and when.
Win rate should be used comparatively from one period to the next to understand whether you’re growing or not.
Again, important questions are answered by the win rate...
- What percentage of our leads do we close successfully?
- How many leads do we lose and why?
- Which salesperson, which season, and to which customers do we sell best?
Revenue growth
The meaning of life, the universe and everything.
It might be the case that win rate doesn’t actually tell you whether your sales operation are growing. It’s perfectly reasonable that you could close more deals but make less money. If so, we simply need to monitor revenue growth as a clear indicator of business growth.
((Revenue generated [previous] - Revenue generated [current])
÷ Revenue generated [previous]) x 100
To calculate the revenue growth of an organisation, we are minus revenue generated in the current period by the revenue generated in the previous period. If our revenue this month is $100 and last month it was $2500, we minus 1500 from 2000 (500) and divide that by 1500 (0.33).
We multiply that by 100 to get our percentage: Our revenue growth is 33%.
Revenue growth is arguably the most important metric of your lot. Revenue growth is a metric that the whole organisation should be concerned with, but is particularly important for C-Suite executives. Revenue growth instantly tells us whether we’re declining, stagnating, or growing. It also tells you when your sales forecast accuracy should be improved.
- Are we going in the right direction?
Tip. For a growing company, it’s easier to look at revenue growth on a comparative basis. They should look at the increments of revenue growth on a month-by-month basis, rather than simply looking at the current revenue they’re generating every month. The latter can be deceiving because of a wide-range of variables that can affect individual deals such as average deal size or time of year.
Churn rate
… or customer retention rate; it depends whether you’re a glass-half-full person.
(Lost customers ÷ Total customers at the start of time period) x 100
Imagine you’ve started June with 2500 active, paying customers. By July 1st, of those original 2500 customers, 50 have decided that they no longer want to subscribe to your service. For the month of June, your churn rate is a (very respectable) 2%. The SaaS average is 4% to 6%. Keep it up!
Note. Churn rate can be defined in two ways - either at the point a subscription ends and renewal didn’t happen, or at the moment of active cancellation by a customer.
Churn rate is useful for subscription-based businesses; typically SaaS services like NetHunt CRM. It calculates the rate of customers dropping off from a service. That is, those who pay their subscription fees for one period, and don’t the next.
Customer churn rate is essential for understanding the effectiveness of a business’s post-sale support, after-purchase care; ultimately the relevancy of its product offering and the speed of its development
After tracking customer churn rate, we can get a grasp on our revenue churn rate. That is, how much money we’ve lost through disillusioned customers and where any holes in the immediate budget are compared to last year.
- Do we have a good product-market fit?
- How fast and why are our customers leaving us?
- Can we improve our after-sale programme?
"Our Customer Success model helps us achieve a beautifully-low churn rate of just 4.3%. On average, SaaS companies achieve an NPS score of 30; we come in at 26. Alas, we’re not bragging; we want to help. Here are the Customer Success strategies we have implemented that have helped us achieve these numbers..."
Anna Pozniak in
How to implement customer success
Average deal size
Size matters.
Total revenue from client orders ÷ Total client orders made
It’s a simple equation really. If your business closed 5 deals worth a grand total of $1000 in the month of January, then your average deal size for that month would be $200. It's better to have clients with relatively equal deal sizes to spread the risks. Imagine you have one big client that generates 50% of your revenue.
When they leave, you lose 50% of your revenue.
Average deal size points to the mean average value of the deals that sit in your pipeline. There are no benchmarks for the best average deal size, as it varies from business to business; product to product. Obviously, the higher the average deal size in your pipeline, the better for your business.
Increasing the number of deals in your pipeline can be difficult, inefficient, and expensive, so increasing the size of the deals in your pipeline is more attainable, by cross-selling or upselling to existing leads and customers.
Average sales cycle
It’s a marathon, not a sprint.
Number of days for all deals ÷ Amount of deals in that period
To calculate your sales length cycle, you add up the total number of days it took to close every sale and divide that sum by the total number of deals. So, in this case: 40+30+60+70 = 200 days total. If we divide 200 by 4, we get 50. Our average sales cycle is 50 days.
A well-defined sales process creates transparency for a business. If your sales cycle is too long, Marketing might want to look at creating bottom and middle-funnel materials to ensure leads close as quickly as they can. An average sales cycle KPI is always a good thing to have as common knowledge.
Between a sales team, the average sales cycle gives them something to aim for when they’re engaging with customers. It’s a benchmark that doesn’t need to be strictly adhered to but deserves a quick glance. Your average sales cycle also forms the basis for future sales pipeline activities.
With a clear understanding of the length of time it takes to complete a sale, you can accurately forecast immediate revenue in your pipeline which is a key component for your team’s sales pipeline strategy. Incorporating the best sales tools can further optimise your sales process and improve cycle times.
- How much money can we expect to make in the immediate future?
- Does my sales team need any sales enablements from me?
Revenue by region
The world’s a big place.
Knowing where the most convertible leads come from for your business is gold dust for marketing managers and sales executives alike. It tells them where they should focus their efforts, resources, and budgets. It helps them understand whether a region is worth investing in further, or whether it’s somewhere that costs can be cut and profits can be saved.
Finally, revenue by region helps define other aspects of your business - which languages need speaking on your support teams and where ad and marketing resources need to be focussed to hit the sweetest spot possible.
- What resources do we need?
- Where can we invest more?
- Where should we invest less?
Tip. Revenue can also be measured by variables such as industry and size. In the SaaS world, we’re not limited to those, and we can look at revenue by lead generation channels to the same end and importance.
Check out the reports you can build in a CRM for sales, marketing, and customer support teams.
Learn how to learn about your business with sales reporting. Take that information and use it to better your business activities and results.


 product experts — let's find the best setup for your team